Debugging Camel K Integrations
Sometimes an Integration can fail or behave unexpectedly for unknown reasons, and a developer needs to investigate the cause of such behavior. Attaching a Java debugger to an integration is a common way to start the investigation.
Even if the Integration Pods run on a Kubernetes cluster, it’s very easy to attach a Java debugger to the remote Integration container using the CLI.
Debugging with VS Code
If you’re a VS Code user, you can watch this video.
Debugging with IntelliJ IDEA
Suppose you’ve started an Integration using the following command:
$ kamel run examples/Sample.javaAn Integration named sample should be running in the cluster. You can use the kamel debug command to put it in debug mode:
$ kamel debug sampleA possible output that you may find is the following:
$ kamel debug sample
Enabling debug mode on integration "sample"...
[1] Monitoring pod sample-8455c8b985-5cxvc
[1] exec java -agentlib:jdwp=transport=dt_socket,server=y,suspend=y,address=*:5005 -cp ./resources:[..omitted..] io.quarkus.runner.GeneratedMain
[1] Listening for transport dt_socket at address: 5005
Forwarding from 127.0.0.1:5005 -> 5005
Forwarding from [::1]:5005 -> 5005
As you can see in the logs, the CLI has configured the integration in debug mode (see option -agentlib:jdwp=transport=dt_socket,server=y,suspend=y,address=*:5005) and started forwarding the local port 5005 on the workstation machine (local port can be changed using the --port option) to the container port 5005, where the JVM is waiting for a debugger.
The JVM is suspended and waits for a debugger to attach by default: this behavior can be turned off using the --suspend=false option.
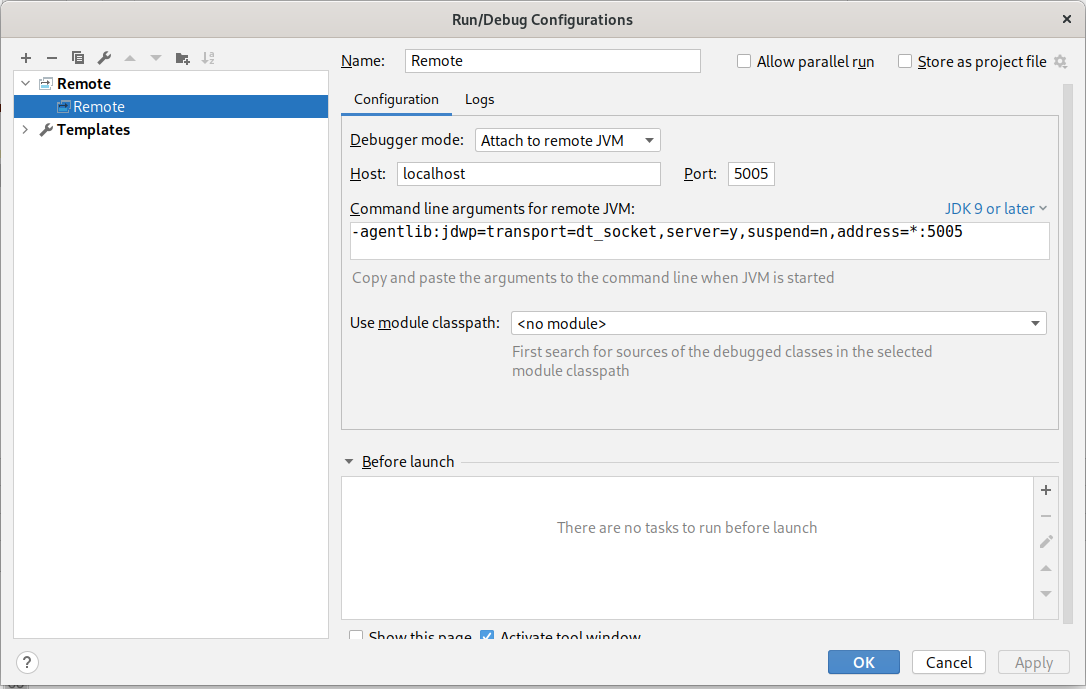
Last thing to do is, to start a remote debugger on localhost:5005 with the integration file (if using Java, Groovy or Kotlin), the Apache Camel project, or the Camel K Runtime project, opened on your IDE.
The following picture shows the configuration of a remote debugger in IntelliJ IDEA:

Once you configure a debugger, you can add breakpoints to various part of the code, then connect the debugger to trigger the JVM startup.
When the debugging session is done, hitting kbd:[Ctrl+c] on the terminal where the kamel CLI is running will restore the integration to its original status.
Debugging Kamelets
As we’ve seen in the previous section, all Integration created in Camel K are finally bundled as a Java application, hence, the possibility to debug via JVM debugger. Any Kamelet you will be using directly in your Route definition or in a Pipe is automatically converted in a yaml route and injected in the Camel Context to be executed. That means that you cannot directly debug a Kamelet as you would do with a Java or any other JVM language Route.
However, you can troubleshoot individually each Kamelet definition by focusing on the specification Flow. As an example, you can create a simple yaml test Route substituting the kamelet:source or kamelet:sink with any mock endpoint that can help you in debugging the single Kamelet flow. Even using a timer and a log component may be enough for a basic check.
the same idea applies for a Pipe which translates to an Integration type under the hood. If you need to debug a Pipe just apply the same troubleshooting technique that you would apply on an Integration. |